![]()
|
On the Effects of Various Degrees of Voluntary Disclosure on Share Returns by Hannu J. Schadewitz, Antti J. Kanto, Hannu A. Kahra, and Dallas R. Blevins |
Hannu J. Schadewitz hannu.schadewitz@uta.fi
is an Assistant Professor of Finance at the University of Tampere (Finland). Antti J.
Kanto kanto@hkkk.fi is a Professor at the
Helsinki School of Economics and Business Administration (Finland). Hannu A. Kahra hkahra@sun3.oulu.fi is a Professor of Finance
at the University of Oulu (Finland). Dallas R. Blevins blevins@um.montevallo.edu is a Professor
of Finance at the University of Montevallo (Alabama). If you would like: (1) a description
of the sources of both the accounting data and the stock market data, (2) the statistical
results of the purely voluntary disclosure forecasting model, and (3) the results of the
cross tabulation of unexpected purely voluntary disclosure with unexpected interim
earnings, please contact Professor Blevins.
If you do not like the background color, you can change it by highlighting the color you prefer in the scroll box below.
Introduction
Managers have access to more complete and timely information than do outside interest groups (Lev, 1989). Interim reports are one way to reduce information asymmetry betweeen managers and investors (Healy and Palepu, 1995). Contrary to annual reports, interim reports are more focused to supply information for one important interest group – investors. Therefore the content of interim reports can be evaluated with investors’ view in mind. Research focusing on different institutional setting (Finland) can yield new information when evaluating the generalizability of prior accounting findings based on U.S. markets. Appendix 1 provides a chrolology of related Finnish regulation. The Finnish Foundation for Share Promotion provides on-line access to trading information. .As an example of this, Kasanen, Kinnunen, and Niskanen (1996) found that earnings management in Finland was largely borne out from the fact, that owners have a preference for stable dividends. The research question attacked in this paper is: does the quantity of disclosure affect the market's reaction to interim earnings information?
The quantity of disclosures can be measured via the use of disclosure indices (Marston and Shrives, 1991). The information that an accounting report contains can be quantified by a disclosure index. Disclosure index is a scoresheet containing specific items that are possible to report in an accounting report. Appendix 2 provides a listing of the elements that comprise the index. Depending on how well those items are reported an accounting report will earn points. The general construction of an index is that the actual total of points that an accounting report receives is divided by the maximum points it would have received by reporting all eligible disclosure items. This makes each ratio an accounting report-specific disclosure index. The quantity of information in an accounting report is higher the higher the obtained disclosure score is.
The impact of interim earnings is measured by the use of the conventional earnings response coefficients (ERC) methodology (Collins and Kothari, 1989). The model is further controlled for potential disturbances associated with risk. The data are from the Helsinki Stock Exchange (HSE) over the period 1985-93. Some of the arguments supporting the use of Finnish interim reports as data are given below. A more complete review of interim reporting regulation and legislation in Finland is presented in Appendix 1. Realted articles are Schadewitz and Blevins (1997b) and Jarvenpaa (1996).
One, Finnish corporations typically announce preliminary annual results (Troberg, 1992). Therefore, much of the information content of the final annual report is anticipated before its announcement. With interim reports, however, there is virtually no formal pre-announcement (Schadewitz and Vieru, 1993). Due to this, such reports are excellent material for the study of the impact of new information presented to the market.
Two, in Finland, dividends and taxes are based on a firm's annual earnings. Therefore, managers can quite openly report the actual operating results in interim reports without direct dividend or tax consequences (Kanniainen and Kurikka, 1984).
Three, Finnish firms are allowed great latitude in the type and amount of information they may disclose in interim statements. This flexibility in disclosure promotes the analysis of the impact of interim report items that disclose various qualities and quantities of information.
Four, Finnish interim reporting provides a measure of a firm's permanent earnings (Appedix 1; HSE Cooperative, 1988, 1991). A comparable standard entry for a firm chartered in the U.S. does not exist. The entry is, however, a very useful one, because it avoids distortions caused by transitory earnings (Schadewitz, 1996; Schadewitz and Blevins, 1997a, 1997b, 1998a, 1998b).
Five, the year 1985 is selected as the beginning year, because this is the first year that the HSE encourages interim reports to be submitted. Specific items to be reported in interim reports are first mandated in 1986. 1993 is the ending year because of the long lead time necessary in the construction of the interim report database. It should be noted, however, that the latest set of requirements, effective 1 January 1994, bears many resemblances to its 1 January 1990 predecessor. Therefore, the research period applied should contain all the relevant legislative issues that are currently valid.
Six, there is recent evidence that the pricing on the HSE is consistent with results reported for major foreign exchanges (Schadewitz, 1997). Thus, the findings reported here may be generalized to other markets, such as those in the U.S. All of this combines to make the degree of information contained in interim reports submitted to the HSE a potential source of new insights into the relationship among earnings, risk and price.
A more complete discussion of Finland may be found in Schadewitz and Blevins (1998c).
Methodology
This article addresses the impact of the degree of disclosure on share prices. A series of computations are required. First, the association among: (1) returns, (2) unexpected, permanent interim earnings and (3) the dispersion of share returns is determined for the entire sample. Next, the sample is divided into subsamples, based on the level of disclosures in interim reports. Three categories are formated: (1) low, (2) medium and (3) high disclosure groups. Finally, the associations between returns and earnings within each group are determined and compared.
The association between share price and a firm’s value can be studied by regressing the information contained in interim reports with contemporaneous share price data. The values of the regression coefficients (ERCs) allow a scrutiny of the extent to which price has captured the firm-specific information that is known before the actual event. A positive association between earnings and returns is expected. The event day is designed as time 0. Standard deviation of returns is included as a variable in the model in order to capture and control potential changes in return variability around the event that are not captured by the market model. The authors hypothesize that this risk variable has a negative association with cumulative abnormal returns (CARs). Beta was not applied here as an independent variable because it has already employed in the CAR computations via market model. Equation (1) is the model used to study overall, pre-event, and post-event price/earnings relations.
CAR (bgn, d)it = b 0 + b 1 UEit + b 2 s Rit+ eit (1)
where:
CAR(bgn, d)it = cumulative abnormal returns in an arithmetic (additive) form, CAR for
stock i on announcement day t. Accumulation starts on the first
business day of the interim reporting period, bgn, and ends on
day d. A negative/positive sign for a day d indicates a pre/post
announcement day.
b
0 = the intercept,b 1 = the earnings response coefficient, ERC, for unexpected earnings, earnings, UE,
b 2 = the regression coefficient of the standard deviation of share returns s Rit
during the (-30, 30) business day period around the announcement day, and
eit = normally and independently distributed error terms for stock i at event t.
Purely voluntary disclosure is measured by interim report-specific disclosure index (see Appendix 2). Because market participants use all relevant information available on the market even before the event there is possibility that share prices contain some of the information that will be released via the forthcoming interim report. Due this we will focus on unexpected portion of information in interim report. Unexpected purely voluntary disclosure enclosed in interim reports, UPVDit, is defined as the difference between the realized and the forecasted levels of purely voluntary disclosure for firm i in interim reporting period t. The forecasts of expected disclosure were obtained from the combined model, consisting of: (1) determinants of disclosure and (2) a random walk forecast of disclosure. Since there are two deterministic forecasting models, a test is performed to see whether these two can can reasonably be assigned equal weighting in a combined model. The test is passed. Consequently, disclosure is forecasted using a combined model, with identical weights assigned to the random walk component and the determinants component.
The random walk based regression is a standard application that is included because of its ability to: (1) capture the incremental significance of the difference between successive interim reports and (2) realistically resemble an actual comparison of two consecutive interim reports.
The determinants forecasting model is an innovation. It is based on a disclosure scoresheet, which identifies those purely voluntary interim-report items that are available to users. Disclosed items are scored following the procedure applied by Giner Inchausti (1997), with exceptions which indicate that a particular item is not reportable for a specific interim report. Giner Inchausti provides empirical analysis of the influence of market and regulatory forces on information disclosure by Spanish firms. In order to test her hypotheses, annual reports of years 1989-91 for 49 firms are analyzed. Those years are around the Spanish accounting rule reform in 1990. The information disclosed by the sample corporations is measured through an information index. That index comprised 50 items of information, and it is regressed on the variables related to company characteristics. The influence of regulation is analyzed through a panel data analysis including time effect. The results show that time is a surrogate for regulation and explains the level of information disclosed. In addition, three firm characteristics were also found to influence the level of disclosure: size, auditing, and stock exchange.
The total number of interim reports for which scoresheets are completed for this research is 573. The number of interim report indices finally used in this research is diminished to 256. There are two reasons for this. One, at least one of the independent variable observations is unavailable for 314 interim reports. Two, there are three interim reports that are excluded as outliers, due to their extreme values. The footnotes to table 1 indicate the specific sample size used in each of the regressions.
An a priori assumption is that managers temper their degree of disclosure by the quality of the information to be revealed. Firms with unexpectedly favorable earnings might be expected to increase their level of disclosure to expound on the high level of competence exhibited by that management group. Also, firms that are experiencing difficulty might be expected to expand their level of disclosure in order to explain the reasons for the poor performance.
Skinner (1994) analyzes corporate earnings-related disclosure practices in a random sample of 93 NASDAQ firms between 1981 and 1990. The main findings are as follows: (1) earnings-related voluntary disclosures occur infrequently; (2) there is a tendency for good news to be reported as a point or range of annual earnings per share, while bad news disclosures tend to be qualitative statements about the current quarter’s earnings; and (3) the stock price response to bad news disclosures is greater than to good news disclosures. In addition, large quarterly negative earnings surprises are preempted about 5 percent of the time by voluntary firm disclosures. The explanation for voluntary bad news disclosure is related to managers’ asymmetric loss function. Managers incur high costs from the concealment of bad news for two reasons: (1) shareholders may sue due to large stock price declines o earnings announcements days and (2) managers may lose their reputation due to their failure to disclose bad news in a timely manner. Some firms may even disclose less than expected. Several things may cause this. Managers may thing that earnings is an adequate measure to measure firm’s performance. In addition, a closely hold firm may have other potential communication channels to communicate with its investors, such as a seat on the board. However, it should be bear in mind that a high level of disclosure create additional consensus among investors leading to increased liquidity for the firm’s stocks (Healy, Palepu, and Sweeney, 1995). As a result, a potential relationship between UE and UPVD exists, but it is very slight.
A disclosure classification is created by dividing unexpected disclosure into quartiles. The F test for the pooling of quartiles two and three is clearly passed five times out of six. Since the two middle quartiles do not essentially differ from each other, they are pooled. Therefore, three unexpected purely voluntary disclosure classes are formulated: (1) the lower quartile is the first fourth of the ranked UPVDits (n = 64), (2) the middle quartiles are the middle half of the UPVDit observations (n = 128) and (3) the upper quartile is the highest fourth of the disclosures observed (n = 63/64).
Results
The results are presented in table 1 below. In general, the CAR results of varying levels of disclosure differ considerably. In the lower quartile, both the model and all of its coefficients tend to receive statistically significant values. In the middle quartiles, just the model and the UE coefficients tend to receive statistically significant values. In the upper quartile, neither the model nor its coefficients tend to be statistically significant. A comparison and an interpretation of the results of these three levels of disclosure is provided in greater detail below. See table 1, below.
Table 1.
Regressions of Unexpected Earnings and Return Variability on Cumulative Abnormal Returns
| CAR (bgn, d) |
Disclosure Less than Expected Lower quartile b, where UPVD < -.04212 |
Disclosure About as Expected Middle quartiles c, where -.04212 UPVD < .04460 |
Disclosure Greater than Expected Upper quartile, where .04460 UPVD |
|||||||||
0 |
UE |
R |
Adj. R2 | 0 |
UE |
R |
Adj. R2 | 0 |
UE |
R |
Adj.R2 | |
Overall -- Interim Reporting Period |
||||||||||||
(bgn, end) |
.139* | .060* | -.125* | .302** | .080 | .046 | -.036 | .000 | .091 | .040 | .005b | .023 |
Pre-Event -- Anticipation Periods |
||||||||||||
(bgn, -30) |
.150** | .048* | -.100* | .290** | .126** | .096** | -.018 | .124** | .110* | .030 | .014a | .011 |
(bgn, -15) |
.138** | .055* | -.110* | .294** | .122** | .109** | -.019 | .126** | .101* | .041* | .010b | .035 |
Post-Event -- Association Periods |
||||||||||||
(bgn, 0) |
.437 | .693 | .026 | .025 | 2.306** | -.030 | -.614 | .004 | 2.402 | .257 | 2.332a* | .080* |
(bgn, 15) |
.140* | .062* | -.148* | .317** | .120* | .138** | -.032 | .151** | .081 | .038 | .000b | .012 |
(bgn, 30) |
.149* | .064* | -.167* | .312** | .121* | .134** | -.043 | .131** | -.081 | .046 | .074b | .019 |
a n = 63; b n = 64; c n = 128; *significance below .05; ** significance below .001.
Disclosure Less than Expected
Discussion of this disclosure class is facilitated by focusing on the columns of table 1, with emphasis on the differences among the coefficients.
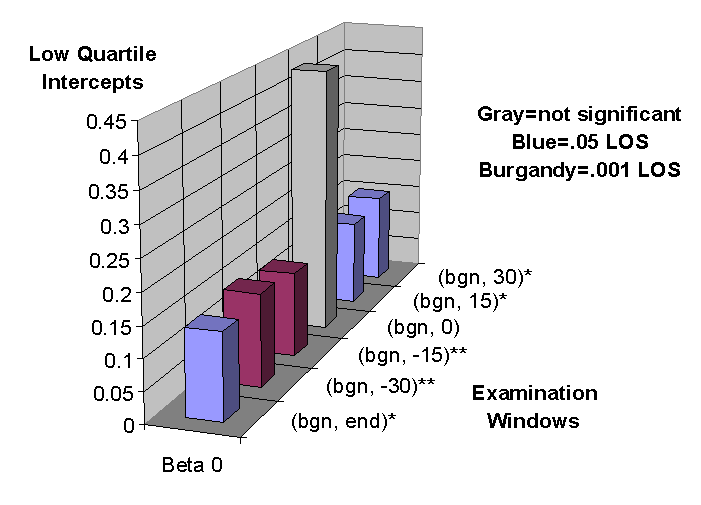
b 0: the Influence of the Event, as Such--The intercept is positive and significant in all but one accumulation period: (bgn, 0). These findings yield the unusual suggestion that, when the subsequent disclosure level is lower than expected, the reporting firm experiences an increase in the CAR. Three guarded, very different, explanations are offered. One, it may be that any publication of interim information, however sparse, is considered good news when the market has a strong need for information. Bhushan (1989) offers a second line of reasoning. His argument revolves around the following chain: (1) low quartile firms have few followers, because there is a lack of information available upon which decisions can be based, (2) those few investors who do follow these firms are relatively uninformed, (3) information asymmetry carries with it the prospect of abnormal profits and (4) the prospect of abnormal profits attracts speculators, who bid up the market price. Three, it may well be that, due to delayed reporting, markets are expecting bad news. Then, when the earnings news are not so bad, the market may respond positively, generating a positive CAR. So markets may conclude (when they realize the delay) that the news (due to the lag) will be bad. The results of the (bgn, -30) and (bgn, -15) windows support this line of rationale, due to their relatively higher levels of confidence. See the bar graph below.
 |
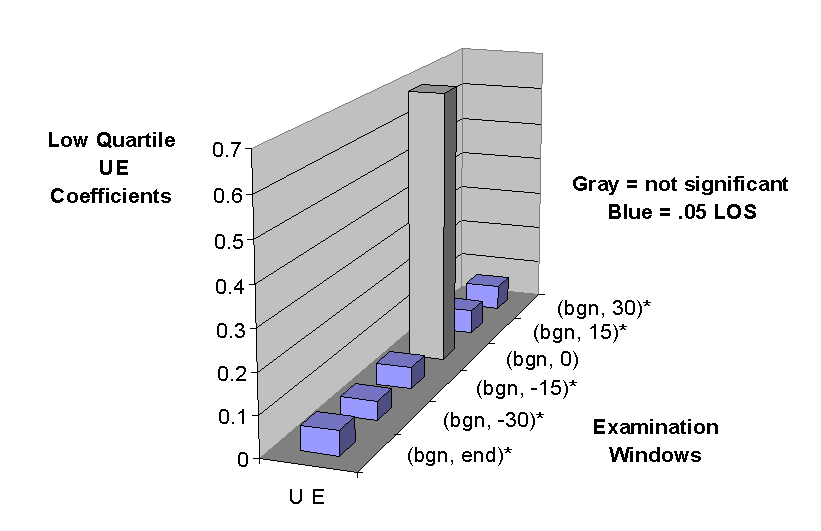
| b 1: the Influence of Earnings--The coefficient for UE is positive and significant for all but one accumulation period: (bgn, 0). This finding indicates that unexpected increases in earnings yield increases in the CAR. This result, very logically, implies that firms with positive unexpected earnings might be rewarded by increasing their disclosure. The significance of earnings coefficient in all but one case ((bgn, 0)), indicates that earnings are an important explanatory factor for abnormal returns even when disclosed in conjunction with low degree of other information. See the bar graph below. |
 |
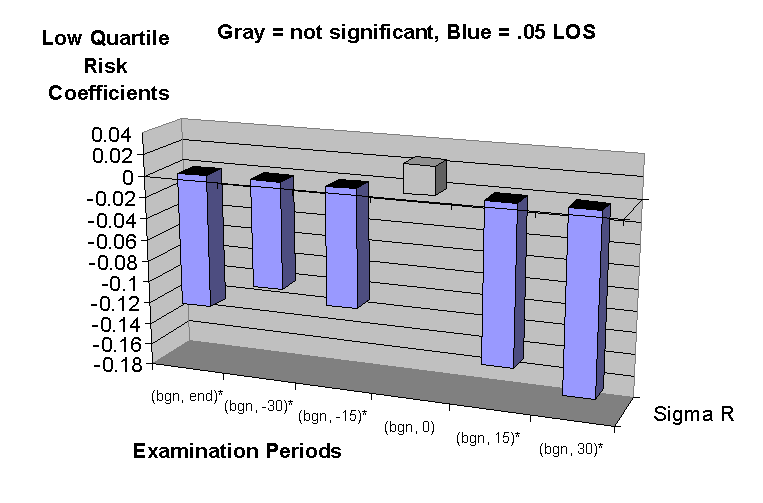
| b 2: the Influence of Share-Specific Risk--Declines in s R yield significant increases in the CAR for all but one accumulation period: (bgn, 0). An inverse relationship between the variability of returns and return is the classical expectation: a reduction in the dispersion of returns would make the stock more valuable. The results in the lower quartile show that lw disclosure is not powerful enough to lower a firm’s risk as an investment target. s R is a control variable in the present paper, which may well be related to a potential reporting lag. The higher the level of risk the management perceives, the greater the incentive to delay publication of that unfavorable material. See the bar graph below. |
 |
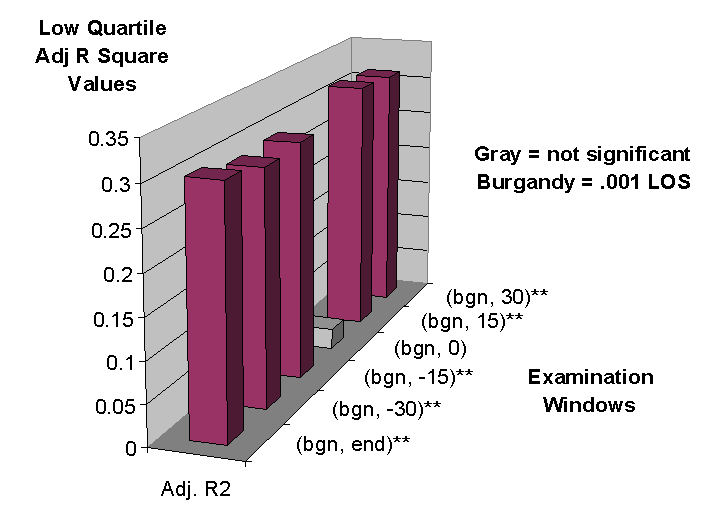
| Adj. R2: the Overall Explanatory Power of the Model--The model is significant at the .001 level in all but one accumulation period: (bgn, 0). Both variables, unexpected earnings and return variability, contributes to the explanatory power of the model. Favorable earnings news will increase CAR but return variability will strongly limit the influence of earnings. The larger the return variability the larger is its power to decrease CAR. More than 70 percent of the total variation in Finnish CARs remain unexplained. Lev (1989) finds this to be evident in the U.S. markets, as well. See bar graph below. |
 |
| Summary of the Lower-than-Expected Disclosure Results--One, firms can make their shares more valuable by increasing their: (1) permanent earnings, due to significantly positive b 1s, and/or (2) level of disclosure, due to significantly positive b 0s, pre-event. This increase in disclosure would also help to eliminate some of the share price variability and its negative pressure for CAR. Two, the reasons for the absence of significance in the (bgn, 0) observation period require further investigation. It could well be that the reason is the time that it takes markets to digest the new published information via interim reports. In order to gain further insight into the assimilation time, subsequent research should focus on shorter observation windows around the event date. |
Disclosure as Expected
Discussion of this disclosure class is facilitated by viewing the changes among the reporting periods (overall, pre-event, post-event), which are listed in table 1.
Overall: Interim Reporting Period--No statistically significant relationship exists over the interim reporting period (bgn, end). This can be understood by the assumption that, when investors are comfortable with the disclosure policies of a firm, they have no need to initiate an early search for more information. In this particular market setting it is important to point out the fact that the HSE is classified as a small but developed (International Finance Corporation, 1993). Further, HSE has some characteristics reflecting its emerging nature as a market place. Related to the topic discussed in this paragraph it should be noted that market analysts were not a central actors in the markets during the research period. This partly explains the low early anticipation of event during the contemporaneous window (bgn, end).
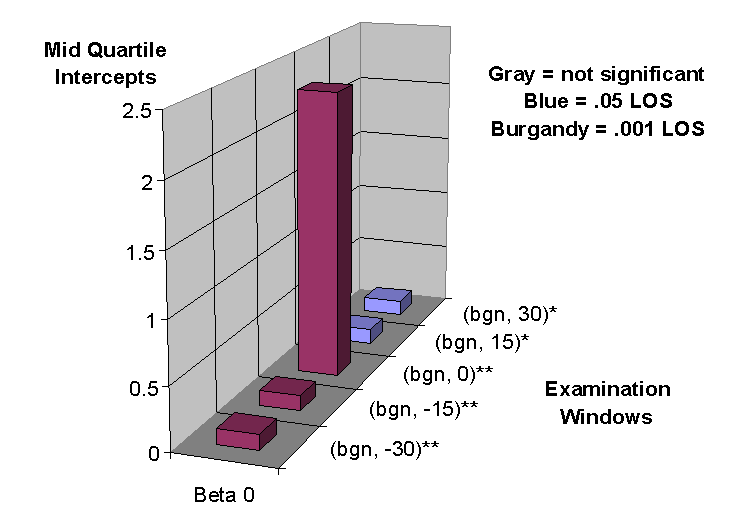
Pre-event: Anticipation Periods—Later, but before the interim report is published, a strong relationship exists with both the intercept and the level of UE. The significant intercepts show that markets reward firms for providing an adequate level of disclosure. See bar graph below.
 |
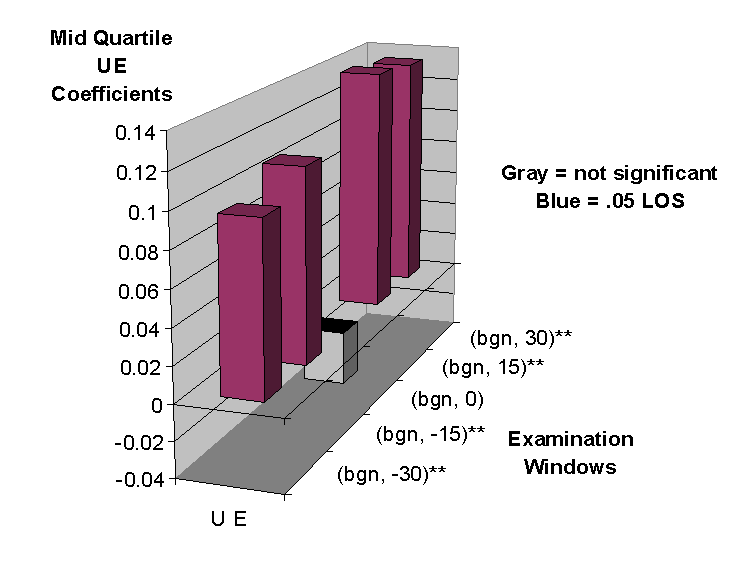
| The significantly positive coefficients for UE indicate that increases in UE yield increases in CAR. See graph below. |
 |
| Both of these relationships conform to a priori presumptions. |
Unlike the lower than expected disclosure results, the coefficients for the s R variables are not significant. This suggests the reasonsble conclusion that Finnish share prices fluctuate less when investors view the level of disclosure as adequate as they do when disclosure is inadequate. In other words, firms have possibilities to eliminate some of the harmful return variability by disclosing adequate amount of information.
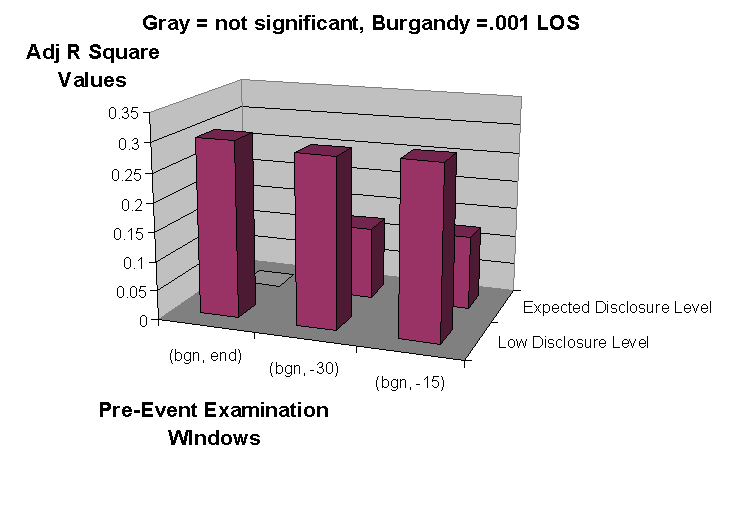
The two models of the pre-event anticipation period remain highly significant, but they explain less of the total variation in CAR than do the models in the lower disclosure quartile. This is mainly because return variability is not statistically significance in the middle quartiles. This is because markets tend to be more content with firms that consistently disclose their operations properly. A large part of the greater significance in the lower disclosure quartile can be attributed to the severe penalty assessed to firms do not sufficiently disclose the results of their interim operations (statistically significant return variability variable). See bar graph below.
 |
| Post-Event: Association Periods--The significance of the intercept explodes for the return accumulation period (bgn, 0), then declines in significance as the interval increases to 15, then to 30 days after the announcement. Despite this, the evidence indicates that firms that adequately disclose the results of their interim operations continue to be rewarded, even after the release of their interim statements. No statistically discernible relationship between UE and CAR exists when the examination period ends on the date of the announcement. This indicates that it takes markets some time to digest and act accordingly at and after the event. However, the longer association periods, (bgn, 15) and (bgn, 30), both show a highly significant relationship of CAR with UE. |
This confirms the importance of reporting unexpected earnings adequately. In line with this finding is the fact that the coefficient for the return variability variable is insignificant trough all the return measurement windows in the middle quartiles. An interpretation is that disclosure policy followed by the management has been succesful in order to diminish return variability. In the lower quartile this is not the case. There return variability was a significant explanatory variable through vast majority of the return windows. See bar graph below.
 |
| Summary of the About-as-Expected Disclosure Results--Firms may increase their share price via: (1) increasing earnings and/or (2) continuing their responsible levels of disclosure. UEs are more strongly associated with the CAR when the market's expectations are matched by the actual level of disclosure than they are when disclosure is less than that expected by the market. This argues that actual disclosure corresponding with the anticipated level of disclosure is an essential factor for the investor. That dimension is drastically overlooked in many previous earnings/returns studies. Finally, as is true for the less-than-expected quartile firms, the period immediately surrounding the event is different from the longer periods. This confirms the need for further research using shorter windows, clustered around the event times. |
Markets experience difficulty in the anticipation of earnings. Further, the significance of the intercept in the anticipation and association periods, indicates that much remains to be discovered about the firm that is not captured by earnings alone
Disclosure Greater than Expected
The results in the upper quartile are very different from those obtained in either the lower or the middle quartiles. That, at least partly, reflects the different position many of those unexpectedly high disclosing firms are compared the previous two categories. A typical firm in the upper disclosure category is a large firm with severe troubles in its business (Kanto, Kahra, Blevins, and Schadewitz, 1998). One, the highest statistical significance for a coefficient or a model is at the five percent level. Two, the period of significance is much closer to the event than is true when disclosure is either lower than or about equal to expected levels.
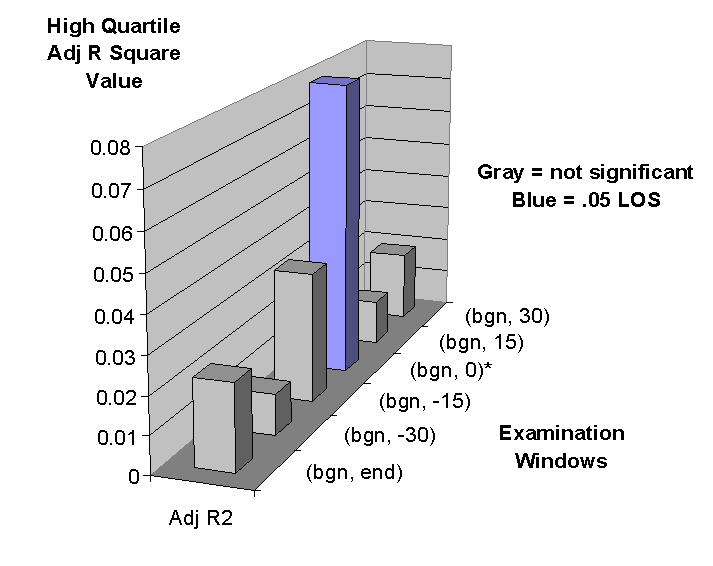
In the upper quartile, the model is significant only for the accumulation period (bgn, 0). Even here, the percentage of variation in CAR that is explained by the market is less than .08, further confirming: (1) the lower-than-expected and the about-as-expected results of this research and (2) results reported for the U.S. (Lev, 1989). See bar graph below.
 |
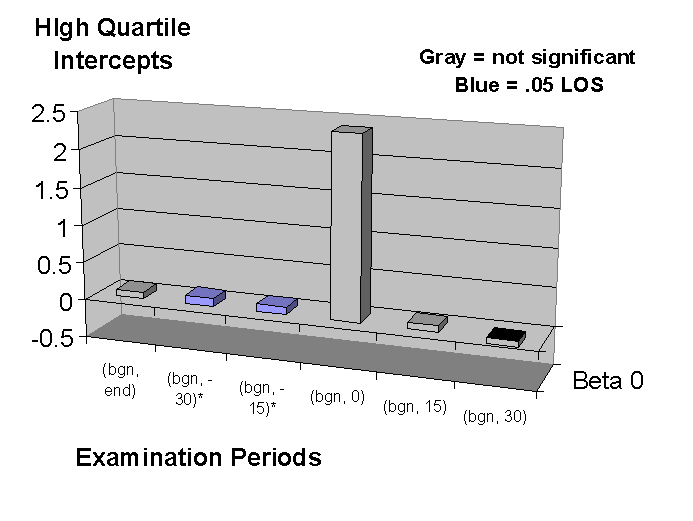
| As is evidenced in the lower quartile, the expectation that an interim report is forthcoming seems, in itself, to be construed as a good news in the upper quartile. This is indicated by the intercept, which is positive and significant for the both pre-event periods examined. See bar graph below. |
 |
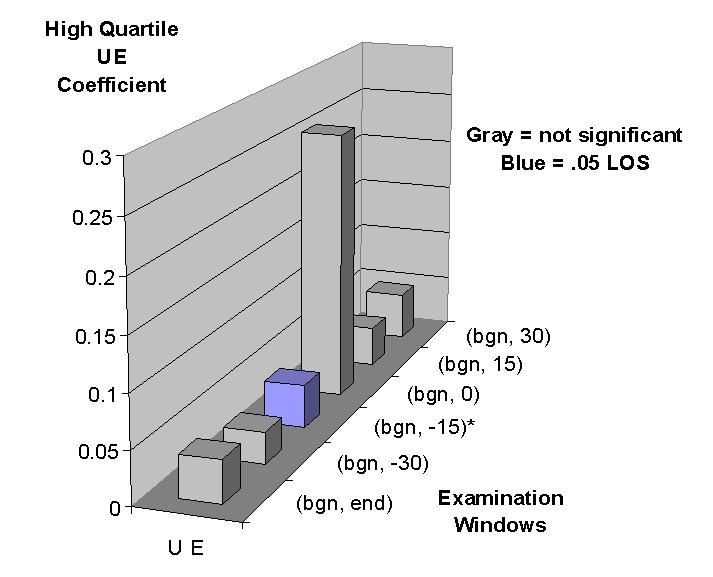
| The coefficient for UE variable is significant only in period ending 15 days before the announcement. See the bar graph below. |
 |
| One reason for this may be that firms, whose disclosures are greater than expected, tend to be facing some difficulty. The market's experience of the firm's lack of past success often combines with a hope for some UE to generate an increase in the firm's share price. The severe penalty assessed by the market for such firms for the period ending on the date of the announcement supports this view. In line with Skinner (1997) there is simultaneously two forces at the market same time: information demand and information supply. In the case when firm has disclosed unexpectedly high degree of information it may be so that the market demand for information has increased even more that the increase in the information supply. This also helps explain why the UE variable is insignificant for examination periods extending beyond the event. |
Three explanations for the lack of market response in the upper quartile are offered. One, it is likely that additional time and effort are required for market participants to analyze an unexpectedly large amount of information disclosed. Two, it is possible that earnings figures are not an equally suitable indicator of a firm's performance among the three different disclosure quartiles. Three, a thorough reading of all 573 interim reports comprising the sample discloses that unexpectedly high disclosure is most commonly associated with firms that are facing difficulties. During troubled times, managers provide extended analyses of their firm's affairs. Such troubles usually generates also some publicity for a firm. As a result, these difficulties are probably recognized by the market, even before the event. However, the market appears to withhold final judgment on the prospects of the firm until they have an opportunity to review the interim statement disclosures. This may also help explain the lack of statistical significance in the upper quartile after the event. Penno (1996) calls this kind of disclosure policy back-to-the-wall, in which management applies a high precision towards toe information they are publishing.
Summary of the Greater-than-Expected Disclosure Results--One, before the event, the market is anticipating the direction of a firm's earnings. This is evidenced by the statistically significant UE coefficient for the period ending 15 days before the event. Two, as is true for both the lower-than-expected and the about-as-expected levels of disclosure, the market interprets the forthcoming event, itself, as good news. The statistically significant intercept supports this conclusion. Three, the event causes markets to evaluate the riskiness of a firm's shares. That is evidenced by the statistically significant coefficient for the risk variable s R (a measure for risk not captured by market risk measure beta) in the period ending on the day of the announcement. Four, the need to perform short-window investigations around the period of the interim report announcement, indicated by the lower-than-expected and the about-as-expected disclosure levels is confirmed.
Summary and Conclusions
This research investigates the impact that various levels of voluntary interim disclosure have on share price returns. The positive relationship between unexpected earnings, UE, and cumulative abnormal returns, CAR, that is found in this research is consistent with theory and previous findings. The returns/earnings association is rather low, providing a Finnish confirmation of the U.S. results.
The new insight provided by this research is the view obtained by dividing the sample into three disclosure level groups. Within each of the three disclosure classes, CAR is explained by UE and a control variable, R, the standard deviation of returns, which is used to assess the earnings quality within each of these groups.
When disclosure is lower than expected, firms with favorable earnings to report should increase their disclosure. In low disclosure category share return variability causes reduction to CAR. Firms whose disclosure levels are about as expected should sustain their disclosure policy in order to build and retain the long-run confidence of their investors. High levels of disclosure tend to be restricted to firms that are confronting some difficulty.
Additional work is needed to examine the period immediately before and after the event.
Each of the three disclosure classes reveals an anomaly around the time of the
announcement. Short window event studies will help disclose the reasons for these
differences.
REFERENCES
Association of Finnish Investment Analysts (1992), Suositus Osavuosikatsausten Sisalloksi
[Recommendation for the Content of Interim Reports]. Helsinki: Multiprint.
Bhushan, R. (1989), 'Firm Characteristics and Analyst Following', Journal of Accounting & Economics, Vol. 11, No. 2/3 (July), pp.255-74.
Collins, D. W. and S. P. Kothari (1989), 'An Analysis of Intertemporal and Cross-Sectional Determinants of Earnings Response Coefficients', Journal of Accounting & Economics, Vol.11, No.2/3 (July), pp. 143-81.
Finnish Foundation for Share Promotion (1998). How to Trade in Finland—A Guide to the Securities Market (http://www.porssisaatio.fi/english/publications.html).
Giner Inchausti, B. (1997), 'The Influence of Company Characteristics and Accounting Regulation on Information Disclosed by Spanish Firms', European Accounting Review, Vol. 6, No. 1, pp. 45-68.
Healy, P. M. and K. G. Palepu (1995), 'The Challenges of Investor Communication--the Case of CUC International, Inc.', Journal of Financial Economics, Vol. 38, No. 2 (June), pp. 111-40.
Healy, P. M., K. G. Palepu, and A. Sweeney (1995), Causes and Consequences of Expanded Voluntary Disclosure, Unpublished manuscript (1995, April): MIT Sloan School of Management, Cambridge; Harvard Business School, Boston.
HSE Cooperative (1988), The Articles, Rules, and Regulations of the Helsinki Stock Exchange. Helsinki: Multiprint.
HSE Cooperative (1991), Rules and Regulation of the Helsinki Stock Exchange (Vol. 1). Helsinki: Author.
HSE Cooperative (1995), Arvopaperimarkkinalaki ja Muuta Arvopaperilainsaadantoa [The Securities Markets Act and Other Securities Legislation]. Helsinki: Painatuskeskus.
International Finance Corporation (1993), Emerging Stock Markets Factbook 1993. Washington, D. C.: Author.
Jarvenpaa, M. (1996), ‘The Relationship Between Taxation and Financial Accounting in Finland’, European Accounting Review, Vol. 5, (Supplement) , pp. 899-914.
Kanniainen, V. and V. Kurikka (1984), 'On the Effects of Inflation in the Stock Market: Empirical Evidence with Finnish Data 1968-1981', Journal of Business Finance & Accounting, Vol. 11, No. 2 (Summer), pp. 139-50.
Kanto, A. J., H. A. Kahra, D. R. Blevins, and H. J. Schadewitz (1998),’An Explanation of the Unusual Behavior of Some Market Model Residuals’, The Finnish Journal of Business Economics, Vol. 47, No. 3, pp. 288-300.
Kasanen, E., J. Kinnunen, and J. Niskanen (1996), ‘Dividend-Based Earnings Management: Empirical Evidence from Finland’, Journal of Accounting and Economics, Vol. 22, No. 1-3 (August-December), pp. 283-312.
Lev, B. (1989), 'On the Usefulness of Earnings and Earnings Research: Lessons and Directions from Two Decades of Empirical Research', Journal of Accounting Research, Vol. 27 (Supplement), pp. 153-92.
Marston, C. L. and P. J. Shrives (1991), 'The Use of Disclosure Indices in Accounting Research: a Review Article', The British Accounting Review, Vol. 23, No. 3 (September), pp. 195-210.
Penno, M. (1996), ‘Unobservable Precision Choices in Financial Reporting’, Journal of Accounting Research, Vol. 34, pp. 141-49
Schadewitz, H. J. (1996), ‘Information Content of Interim Earnings Components—Evidence form Finland’, Journal of Business Finance and Accounting, Vol. 23, pp. 1397-1414.
__________ (1997), Financial and Nonfinancial Information in Interim Reports--Determinants and Implications, Published Doctoral Dissertation, Helsinki School of Economics and Business Administration.
Schadewitz, H. J. and Blevins, D. R. (1997a), 'An Identification of Purely Voluntary Disclosures in Finnish Interim Reports from 1985 to 1993', Contemporary Developments in Finance, pp.197-214.
__________ (1997b), 'Comparison of Interim Reporting Regimes Between a Mature and an Emerging Market’. Journal of Financial Regulation and Compliance, June, pp. 125-135.
__________ (1998a), 'Major Determinants of Interim Disclosures in an Emerging Market', American Business Review, Vol. 16, No. 1(January), pp. 41-55.
__________ (1998b), 'A Preliminary Analysis of the Semi-Strong Efficiency of the Helsinki Stock Exchange', International Journal of Management, Vol. 15, No. 2 (June), pp. 181-88.
__________ (1998c), 'Consider Finland: Gateway to Northern Europe’, Business Quest, submitted.
Schadewitz, H. J. and M. J. Vieru (1993), Risk Pattern Around Announcement of Interim Reports: Tentative Experiments, Working Paper for the European Institute for Advanced Studies in Management Workshop on Financial Accounting in September, 1993, (Helsinki School of Economics and Business Administration, University of Oulu).
Skinner, D. J. (1994), 'Why Firms Voluntarily Disclose Bad News', Journal of Accounting Research, Vol. 32, No. 1 (Spring), pp. 38-60.
Skinner, D. J. (1997), 'Earnings Disclosures and Stockholder Lawsuits', Journal of Accounting and Economics, Vol. 23, No. 3 (November), pp. 249-82.
Troberg, P. (1992), 'Recent Developments in Financial Reporting in Finland', Advances in International Accounting, Vol. 5, pp. 25-45.
Appendix 1
A Chronology of the Recent Regulation of Interim Reporting in Finland
This presentation is based on the section 4.2.3 in Schadewitz (1997). The four major steps in the development of interim financial statement regulations are:
January 1, 1986 (effective date) recommendation concerning interim financial statements (HSE Cooperative, 1988, p. 18)
December 31, 1987 (effective date) recommendation for a listed firm’s interim financial statements (HSE Cooperative, 1991, pp. 47-48)
January 1, 1990 (effective date) recommendation concerning interim reports (HSE Cooperative, 1991, pp. 26-27), and
January 1, 1994 (effective date of the amendments) the Securities Markets Act of 1989 [Arvopaperimarkkinalaki 1989] including regulations for interim reports (HSE Cooperative, 1995, p. 19).
The recommendation of December 31, 1987 consists of the minimum items that a listed firm has to announce (HSE Cooperative, 1991, p. 48):
results after financial items
+/- other income and expenses
= results before closing entries and taxes.
Above information should be given for the current reporting period and for the corresponding time during the previous accounting period as well as for the whole previous accounting period.
The recommendation of January 1, 1990 requires more detailed specifications of changes in the listed company’s commitments compared to the previous recommendation. Further, it is required firms to make public their decision cornecrning the number of interim reports to be published in the coming financial year. Under the January 1, 1990 recommendation, the interim report had to be made public within two months after the close of the period reviewed. The Securities Markets Act allowed the lag to be one months longer: three months.
The recommendation of January 1, 1994 bears many resemblances to its predecessor recommendation. The major difference is that the current recommendation is part of the Securties Markets Act and as such its legal status is considerable (HSE Cooperative, 1995, p. 19). Interim reports must also comply with the Resolution of the Ministry of Finance (op. cit., p. 40). The guidelines of the HSE are also valid in parallel. It should be mentioned that regulatory regime for interim, as well as for annual reports, in Finland conform with European union (EU) practice.
According to the Resolution of the Ministry of Finance (effective date July 1, 1995), a firm’s interim report should contain an explanatory statement and an accounts statement. Furthermore, the Resolution stipulates the content of accounts statements in detail, to include numerical disclosures, where appropriate, for: (1) all main income statement components, other income and expense components reports witout netting; (2) major assets and liabilities together with appropriations; (3) investments; (4) number of personnel; (5) order backlog and evaluation of principal risks; (6) commitments and contingencies, including those for financial derivatives.
Finally, also Finnish financial analysts have provided some recommendations covering
interim reports (Association of Finnish Investment Analysts, 1992).
Appendix 2
Data Schedule for Disclosure Scoresheet
a)Interim report-specific disclosure scoresheet
Date of entry:
Firm:
Interim report (reporting period in months/reporting year):
A. Management report
A.1. Management overview
1. Review of operations for the reporting period frequencies of items
0.0 review not disclosed 4
0.5 review with few comments 144
1.0 review with an analytical discussion 425
573
2. Competitive position and market share
0.0 items not disclosed 113
0.5 items with few comments 249
1.0 items with an analytical discussion 211
573
3. Earnings per share (EPS)
0.0 EPS not disclosed 427
0.5 disclosed present value of EPS 137
1.0 disclosed anticipated value of EPS for remainder of the year 9
573
4. Number of employees
0.0 figures not disclosed 180
1.0 figures disclosed 393
573
a) see also Schadewitz (1997, pp. 226-232).
5. Subsequent events
0.0 events not disclosed 310
0.5 events with few comments 201
1.0 events with an analytical presentation 62
573
6. Outlook for the remainder of the operating year
0.0 outlook not disclosed 46
0.5 outlook with few comments 403
1.0 outlook with an analytical presentation 124
573
A.2. Investments and finance
7. Presentation of anticipated investments
0.0 no information on anticipated investments 315
0.5 anticipated investments disclosed with few comments 134
1.0 anticipated investments disclosed with a thorough presentation or
explicitly stated that anticipated investments will be small in size 124
573
8. Management discussion of financial position
0.0 financial position not disclosed 95
0.5 financial position with few comments 277
1.0 financial position with an analytical discussion 201
573
9. Presentation of anticipated capital structure
0.0 anticipated capital structure not disclosed 412
0.5 anticipated capital structure with few comments 71
1.0 anticipated capital structure with an analytical discussion 90
573
B. Information in financial statements
B.1. Information in general
10. Accounting standards applied
0.0 no information about accounting standards 11
0.5 information according to Finnish accounting standards
or according to other international accounting standards 501
1.0 information according to both Finnish and
some international accounting standards 61
573
11. Income statement (voluntary components)
0.0 only mandatory components disclosed 91
0.5 at least two voluntary income statement components disclosed 280
1.0 all major income statement components disclosed 202
573
12. Balance sheet
0.0 balance sheet not disclosed 430
0.5 at least the sum of total assets disclosed 59
1.0 all major balance sheet components disclosed 84
573
B.2. Business segment information
13. Breakdown of turnover or net sales by business segment
X only one business segment 17
0.0 several business segments, segmental components not disclosed 122
1.0 several business segments, segmental components disclosed 434
573
14. Breakdown of income by business segment
X only one business segment 17
0.0 several business segments, segmental income not disclosed 515
1.0 several business segments, segmental income disclosed 41
573
B.3. Geographical information
15. Breakdown of turnover or net sales by geographical area
X domestic turnover only 113
0.0 several areas, not disclosed 290
0.5 several areas, disclosed by domestic and foreign 118
1.0 several areas, disclosed by areas 52
573
16. Breakdown of income by geographical area
X domestic income only 113
0.0 several areas, not disclosed 459
0.5 several areas, disclosed by domestic and foreign 1
1.0 several areas, disclosed by areas 0
573
B.4. Disclosure and analysis of components related to financial statements
17. Turnover or net sales
0.0 no information on the component 1
0.5 component disclosed with few comments 212
1.0 component disclosed with an analytical discussion 360
573
18. Research and development (R&D)
0.0 no information on R&D 370
0.5 R&D disclosed with few comments 157
1.0 R&D disclosed with a reasonable explanation or
explicitly stated that R&D has minor importance 46
573
19. Depreciations of property, plant, and equipment
0.0 depreciations not disclosed 488
0.5 depreciations disclosed with few comments 69
1.0 depreciations disclosed with a thorough explanation 16
573
20. Result after financing items
0.0 no information on the component 142
0.5 component disclosed with few comments 306
1.0 component disclosed with an analytical discussion 125
573
21. Other income and expenses
X other income and expenses of minor importance 172
0.0 no information on other income and expenses 214
0.5 other income and expenses with few comments 117
1.0 other income and expenses with a thorough explanation 70
573
22. Result before appropriations and taxes
0.0 component disclosed without comments 46
0.5 component disclosed with few comments 351
1.0 component disclosed with an analytical discussion 176
573
23. Inventories and valuation
0.0 no information on inventories 433
0.5 inventories with few comments on valuation 135
1.0 inventories with a thorough explanation of valuation or
explicitly stated that inventories are of minor importance 5
573
24. Order book and the order backlog
0.0 no information on orders 235
0.5 order book mentioned with few comments 209
1.0 order book and order backlog mentioned with a thorough
presentation or explicitly stated that orders are of minor importance 129
573
25. Leasing contracts
0.0 no information on leasing contracts 498
0.5 leasing contracts with few comments 54
1.0 leasing contracts with a thorough presentation or
explicitly stated that leasing contracts are of minor importance 21
573
26. Commitments and contingencies
0.0 no information on commitments and contingencies 282
0.5 commitments and contingencies with few comments 228
1.0 commitments and contingencies with a thorough explanation
or explicitly stated that no commitments and contingencies 63
573
Specified criteria for interpretation of a particular scoresheet item or interim report
1. The PVD index tracks items that are purely voluntary throughout the whole research period of 1985-93. The item numbers in the disclosure scoresheet fulfilling these voluntary criteria are: 2 through 16, 18, 19, and 23. The specific classification of various items or interim reports in certain years is given in statements 2 through 5 below.
2. In 1985 there were no mandatory reports or items. All interim reports published in 1985 were classified as voluntary.
3. Between 1.1.1986 and 31.12.1987, the following index item numbers were excluded from the compilation of the voluntary disclosure index: 1, 17, 21, 22, and 24. When a firm published more than one interim report, the other interim report(s) for other period(s) was (were) classified as voluntary.
4. Between 1.1.1988 and 31.12.1989, the following index item numbers were excluded from the compilation of the voluntary disclosure index: 1, 17, 20, 21, 22, and 24. When a firm published more than one interim report, the other interim report(s) for other period(s) was (were) classified as voluntary.
5. Between 1.1.1990 and 31.12.1993, the following index item numbers were excluded from the voluntary disclosure index: 1, 17, 20, 21, 22, 24, 25, and 26. Between 1990 and 1993, HSE-listed firms were given the option of publishing: (1) one six-month report or (2) two interim reports covering equal periods. In practice, this means: (1) one six-month interim report or (2) two interim reports, the first covering the first four months of the operating period, the second covering the second four months of the operating period. Interim reports exceeding these frequency requirements are classified as voluntary.
