Mark Herrmann ffmlh@fortune.uafsom.alaska.edu is an Associate Professor, Department of Economics, University of Alaska, Fairbanks. Kristen Keith is an Assistant Professor, Department of Economics, University of Toledo.
Introduction
Mushing, or dogs pulling sleds, has long provided the inhabitants of the Northern regions of the world with economic benefits, although the relative importance of the different types of mushing activities, e.g., hauling, racing, etc., has changed over time. In historic times, dogs were primarily used for hunting, trapping, packing, and hauling. For example, there is evidence that over four thousand years ago nomadic tribes in Siberia, known as the Chukchi and the Samoyed, used their dogs as pets, guard dogs, reindeer herders, and sled pullers. This use of dogs as sled pullers spread across the Polar North, and by 1800 BC, Eskimo groups on the Alaskan shores of the Arctic Ocean were using dogs to pull toboggans. [Coppinger, 1979]
As European explorers pushed into the Polar North in search of adventure, scientific knowledge, and wealth, they found it to their advantage to copy Native survival methods, especially the use of sled dogs for transportation. These explorers were followed by hunters, trappers, and miners, many of whom came to the Arctic in search of extractable resources such as fur, ivory, gold, etc. As parts of the Arctic developed commercially, sled dogs were relied upon more and more as a major means of transportation. For example, in the early 1900s, sled dogs had become such an important form of transportation in Arctic areas such as Alaska that numerous commercial mushing operations existed to haul everything from mail and supplies to passengers between the major supply centers and the outlying areas. [Coppinger, 1979]
As transportation technology developed and machines were modified to withstand the extreme weather conditions in the Arctic, the commercial use of sled dog transportation decreased. In the 1930s, the airplane started to displace sled dogs in hauling freight and delivering mail, and in the1960s, snowmachines began to be used as a major means of winter transportation in Arctic areas. However, a renewed interest in dog mushing began in the mid to late 1970s. It was sparked by a combination of two things. First, there was an increasing recognition by rural residents of the relatively large financial commitment and the limitations of snowmachine ownership. Second, the 1970s saw a renewed interest in the sport of sled dog racing. [Anderson, 1992]
Dog racing developed as a North American sport in the early decades of the 20th century. In 1908, the All-Alaskan Sweepstakes was organized in Nome and became the first officially judged mushing event. The new sport quickly spread across Alaska, into Canada, then South to Idaho and California, and finally East to New England. By 1932, sled dog racing was popular enough that an exhibition race was included as part of the Third Winter Olympic Games at Lake Placid, New York. Although sled dog racing was suspended during World War II, a few months after the armistice, races were held in Alaska, Idaho, and New England. [Coppinger 1979] Since then, sled dog racing has steadily increased in popularity. For example, following World War II there were only four sled dog clubs in North America; thirty years later the number of sled dog clubs in North America had increased to 115. In recent years, the increased interest in mushing is undoubtedly due in part to the development of large-prize, long-distance, and highly publicized races such as the Iditarod and the Yukon Quest. [Anderson, 1992]
In this paper the various economic aspects of dog mushing are examined with an emphasis on sled dog racing. Used is data from surveys conducted by Mushing magazine and the International Federation of Sleddog Sports to describe the socioeconomic characteristics of a typical musher, the types of dog-related activities that he or she engages in, and the number of years of mushing experience. Further, these musher-specific variables are used to determine the average number of dogs in a kennel and the average amount a musher spends on his or her dogs according to musher type. In order to isolate the primary economic contribution of the racing industry, a simulation is performed that focuses on the statistically important musher-specific variables. Finally, the conclusion includes a discussion that centers on the need for further research into this fascinating aspect of Northern life.
The Mushing Magazine Survey
There have been few studies that have examined the economic impact of dog mushing on local economies. This is most likely a result of the lack of data on mushers and mushing. One reason more surveys have not been performed to generate the necessary data is because many mushers live in remote parts of the Northern regions, making it difficult to locate and to contact them. Two exceptions are studies by Anderson (1992) and Smith (1989). Anderson surveyed 68 rural mushers along the Yukon River drainage area to assess the importance of subsistence-caught fish in feeding dog teams. Smith surveyed 181 mushers in Interior Alaska to estimate their willingness to pay for mushing habitat.
Although neither Anderson's nor Smith's studies specifically examined the importance of dog mushing on a local economy, both studies revealed that one of the reasons people mush is because of the cash income that can be derived from dog-related activities such as racing, trapping, breeding dogs, and renting or leasing dogs or dog teams. For example, Anderson found that 87 percent of the surveyed rural mushers reported using their dogs in one or more potential cash-generating activities. And although two-thirds of Smith's sample consisted of individuals who lived in "metro" areas, and, consequently, were more likely than rural mushers to engage in mushing for purely recreational reasons, Smith found that 27 percent of the individuals sampled relied on mushing for a portion of their cash income.
This study makes use of a unique data set to estimate the effect of sled dog racing on the total numbers of dollars that the average musher spends on his or her dogs. In the Nov./Dec. 1992 and Jan./Feb. 1993 issues of Mushing magazine, a reader survey was enclosed to research various aspects of mushing (the survey questions can be made available upon reader request). Because Mushing is read worldwide and is the most widely circulated publication dealing with dog mushing, the data from this survey includes information on mushers who live in Alaska, other regions of the United States, Canada, and other parts of the world.
The survey was sent out twice in press runs of 6,000 magazines each. Four hundred and twenty-six reader surveys were sent back to Mushing and, subsequently, released to our research team with the provision that we would not release information that would violate the confidentiality of any individual returning the survey or any business aspects that Mushing magazine wished to keep confidential. Of the 426 returned surveys, 12 were discarded because of incomplete information, which left 414 for the analysis.
It is important to note that the Mushing magazine survey was by no means scientific, and the results should be interpreted in light of who was surveyed and how the survey was performed. The survey was printed on a postcard inserted into two consecutive Mushing issues, and the reader needed to fill the survey out, place a stamp on it, and mail it back to the magazine office. The total response of 425 readers represented 7.1 percent of the Mushing magazine press run.
Table 1
The Mushing Magazine Reader Survey Response Averages
Number of Dogs | 11.8 |
Dollars Spent/Year on Dogs (in U.S. dollars) | $3,058 |
Dollars Spent/Year on Dogs (per dog) | $259 |
Number of Years in Mushing | 9.8 |
Activities: (in percentages) |
|
Weight Pulling | 17% |
Skijoring | 29% |
Carting | 33% |
Packing | 21% |
Sledding | 81% |
Camping | 50% |
Racing | 49% |
Hiking | 39% |
Hunting | 9% |
Recreation | 54% |
Working | 25% |
Geographic Area of Residence |
|
United States (excluding Alaska) | 71% |
Western U.S. | 17% |
Eastern U.S. | 33% |
Midwestern U.S. | 21% |
Alaska | 19% |
Canada | 7% |
Rest of World | 4% |
Married | 68% |
Single | 32% |
Number of Children | 0.81 |
Annual Household Income Level |
|
Less than $15,000 | 11% |
$15,000 to $35,000 | 39% |
$36,000 to $49,000 | 19% |
$50,000 to $74,000 | 16% |
$75,000 to $100,000 | 11% |
Over $100,000 | 4% |
Education (years) |
|
1-12 | 22% |
13-16 | 48% |
17 or more | 30% |
Subscribers to Mushing Magazine | 92% |
The Survey Statistics
Table 1 (above) gives a summary of the Mushing magazine reader survey. The respondents averaged approximately 2.5 people per household and owned an average of 11.8 dogs. The number of dogs per kennel ranged between 1 and 145. The average number of U.S. dollars spent on dog mushing per year, per household was $3,058, with a range of from $120 to $30,000. By dog, the average expenditure per year was $259, with a range of from $30 to $3,000 per dog. The average number of years that a respondent had been interested in the sport of mushing was nearly 10 years.
The next category of questions concerned the activities in which the respondents used their dogs. The respondents could check as many of the categories as they wished, which, in fact, they did because many of the categories overlap. The average respondent checked 4.3 out of the 12 categories. The activities used in this study ("other" excluded) are:
1. Weight pulling (dogs pulling sleds loaded with weight for a short distance, usually for money or prizes),
2. Skijoring (one or more dogs pulling a cross-country skier),
3. Carting (dogs pulling carts, usually as a means of summer training, racing, or both),
4. Packing (dogs carrying packs for hikers),
5. Sledding,
6. Camping,
7. Racing (which includes recreational and professional sprint races and distance races as well as some skijoring races),
8. Hiking,
9. Hunting,
10. Recreation, and
11. Working (which includes hauling water and firewood, running a trapline, watching for bears, etc).
The most checked activity was sledding, at 81 percent. Sledding is, by definition, a necessary part of many of the other activities. Over one-half of the respondents used their dogs for some type of recreational activity, with 50 percent using their dogs for camping. Thirty-nine percent used their dogs for hiking, and 33 percent used their dogs for packing. Only 9 percent used their dogs for hunting. Nearly half of the respondents used their dogs to race. Twenty-nine percent used their dogs to skijor, and 17 percent used their dogs for weight pulling.
The respondents gave their area of residence by filling out their city, state, zip code, and country of primary residence. Ninety percent of the respondents lived in the United States; 7 percent of the respondents lived in Canada, and 4 percent lived somewhere in the rest of the world. Thirty-three percent of the U.S. residents lived in the East; 21 percent lived in the Midwest; 17 percent lived in the West, and 19 percent in lived Alaska.
Sixty-eight percent of the respondents indicated that they were married. The average number of children in each household was 0.8. Twenty-two percent of the respondents had completed 1 to 12 years of education; 48 percent had 13 to 16 years of education; and 30 percent had 17 or more years of education. Finally, 50 percent of the respondents had annual household income levels between 0 and $35,000 (U.S. dollars); 35 percent had annual household income levels between $36,000 and $74,000, and 15 percent had annual household income levels greater than $75,000 per year.
Despite the unscientific survey method, the results are fairly similar to the results from other more comprehensive surveys of smaller areas. Anderson (1992) surveyed 7 of the 32 rural communities along the Yukon River drainage in Alaska. The Yukon River drainage is the part of the river that extends from the Bering Sea to Canada, horizontally cutting Alaska in half. This drainage area is primarily populated by subsistence users who have kennels that range from 4 to 80 dogs, with an average of 15.8 dogs. Of the respondents in that survey, 54.5 percent reported that they used their dogs for sprint racing, and 27.9 percent used their dogs for distance racing. Eighty-two percent reported using their dogs for sledding or camping or recreational purposes.
Smith's results from a survey of Interior Alaskan mushers revealed a similar number of years in mushing and similar income levels to the ones found in Table 1. She reported that 84 percent of her respondents had been involved in mushing for more than three years, and over half of these individuals had been involved for more than ten years. And, although her income ranges differed slightly, the reported income levels from her survey are remarkably similar to those from the Mushing magazine survey. Fifty percent of Smith's respondents had annual income levels between 0 and $34,999 (U.S. dollars); 29 percent had annual income between $35,000 and $54,999, and 22 percent had annual income equal to or greater than $55,000.
Sled Dog Races
There are many types of mushing races, ranging from skijoring races to sprint sledding races to mid-distance and long-distance sled racing. Some of these races command high purses and attract racers from all over the world. Others are local community events that are seen as a form of entertainment or a chance to win a small amount of prize money.
In 1993, the International Federation of Sleddog Sports (IFSS) performed a comprehensive survey of both professional and amateur races in an attempt to document all of the world's mushing races. While most races are sprint races, most of the prize money is in the mid-distance (100 to 300 miles) and the long-distance (300 miles or more) races. More than half of the world's races in 1993 offered prize money, although in Europe only 10.9 percent of the events offered cash prizes. In total, North America paid out nearly 90 percent of the total prize money. The largest single races are the premier long-distance races, the Iditarod (Alaska), Yukon Quest (Alaska and Canada) and the Alpirod (Italy-Austria-France), which together had prize money in 1993 of $651,500, with the Iditarod being the top race at $400,000. While Alaska accounted for 18.5 percent of the total races, it paid out over one-half of the prize money ($1,291,850 in 1993).
Comparing the 1993 IFSS survey to a similar IFSS survey performed in 1989, it appears that sled dog racing is becoming more popular and is attracting more prize money. Between 1989 and 1993, the number of competitive sled dog racing events increased by 30 percent; the number of race entrants increased by 68 percent; and the dollar value of prizes increased by 24 percent (in nominal terms).
The Model
In order to get a better understanding of the amount of hard currency that is spent on the sport of sled dog racing, we developed an econometric model to estimate the relevance of mushing experience, dog-related activities, and various socioeconomic factors, to the number of dollars that mushers spend on their dogs. The following two equations describe the impact of racing on primary expenditures on dogs:
(1) DOGS = f1 (No. of Years in Mushing, Activities, Socioeconomic Variables),
(2) DOL = f2 (No. of Dogs, No. of Years in Mushing, Activities, Socioeconomic Variables). The first equation states that the number of dogs each musher owns is a function of the number of years that they have been in mushing; the types of activities that they use their dogs for; and various socioeconomic factors such as marital status, years of education, and annual household income. The second equation states that the total number of dollars spent on mushing per year is a function of the number of dogs that each musher owns; the number of years that they have been in mushing,; the type of activities they use their dogs for; and the same socioeconomic factors.
It seems reasonable to assume that the total amount of dollars spent on mushing is positively related to the number of dogs; that is, the greater the number of dogs, the more money a musher will spend on dog food, veterinary bills, etc. However, there is no reason to assume that the number of dogs is in any way dependent on the number of dollars that is spent on mushing. Because the dependency between these two variables is one way--the total amount of dollars spent on mushing depends on the number of dogs, the use of the single equation estimation technique, Ordinary-Least Squares (OLS), is proper. [Maddala, 1992]
From equations 1 and 2 we are able to test the importance of the various independent variables in determining, first, the number of dogs that a musher will have and, second, the amount of hard currency that the musher will spend on mushing. Through simulation analysis, mushers who specialize in racing can be sorted out from those who specialize in other types of activities. As interest in racing grows in the sport of mushing, this type of model can be used to predict the increased initial monetary outlay of the sport to local communities.
The Estimation and Simulation Results
The results from the initial estimations included all of the explanatory variables in Appendix A. The original equations were paired down by omitting all of the statistically insignificant variables (the original equations are available from the authors by request). Because an efficiently estimated racing coefficient is important for the simulation, restricted versions of the original estimated equations were re-estimated using only the relevant variables -- that is, those variables in the original estimation that had a "significant" impact on the dependent variables. For the number-of-dogs equation, these variables are number of years in mushing and the activities of weight pulling, racing, and hunting. For the number-of-annual-dollars equation, these variables are the number of dogs, the activity of racing, living in the Midwest or the East, and having an annual income of $50,000 or more. The results from estimating the restricted equations are presented in Tables 2 and 3 (below).
Table 2
Econometric Re-Estimation for the Number of Dogs in Each Kennel
Variable | Parameter Estimate | t-value |
Intercept | 2.61 | 2.37 |
Number of Years | 0.42 | 6.00 |
Weight Pulling | -5.21 | -3.25 |
Racing | 11.11 | 9.16 |
Hunting | 5.67 | 2.73 |
R squared | 0.259 | -- |
Adjusted R squared | 0.252 | -- |
Table 3
Econometric Re-Estimation for the Dollars Spent per Year on Dog Mushing
Variable | Parameter Estimate | t-value |
Intercept | 865 | 3.45 |
Number of Dogs | 146 | 4.69 |
Racing | 953 | 3.38 |
MWEAST | -840 | -3.25 |
I456 | 1384 | 4.96 |
R squared | 0.461 | -- |
Adjusted R squared | 0.456 | -- |
Notes: MWEAST is the percentage of mushers living in the midwestern or the eastern region of the United States, and I456 is the percentage of mushing households making over $50,000 per year.
From the estimated equations, the parameter values can be directly interpreted as the additional contribution of dogs (Table 2) or annual dollars spent on mushing (Table 3) of a one-unit increase for the continuous explanatory variables or as an absolute shift for the activity variables. For example (using Table 2), the number of years in mushing is multiplied by the number-of-years coefficient to determine the impact of mushing experience on the number of dogs owned. For equal values of the other variables, an individual who had been mushing for seven years would be expected to own approximately two more dogs than someone who had been mushing for two years, or (7 - 2) * 0.42 = 2.1. If a musher was also involved in racing (an activity variable), the coefficient on the racing variable indicates that this individual will have an additional 11.11 dogs in the kennel over someone who does not take part in racing. Alternatively, someone who participated in weight pulling would subtract 5.2 dogs from the default kennel. Therefore, the average individual who mushed for five years and used his or her dogs for racing would be expected to own approximately 15.7 dogs (2.61 + 5 * 0.42 + 11.11), while another musher who had mushed for five years but did not race (or hunt or weight pull) would own approximately 4.71 dogs (2.61 + 5 * 0.42).
The results for the estimated equation for the annual dollars spent on mushing is reported in Table 3. These results can be interpreted in the same way as those from Table 2 except that the coefficients represent increases (if positive) or decreases (if negative) in the number of dollars spent by a musher per year. For example, an average musher who had five years of mushing experience, participated in racing, lived in Alaska, and made less than $50,000 a year (who, we calculated, has 15.7 dogs) would spend $4,110 annually in hard currency on mushing-related activities (865 + 15.7 * 146 + 953). A similar average musher who did not race (owning 4.6 dogs) would spend $1,536 per year (865 + 4.6 * 146). In the expenditure equations, the expenditures on the entire kennel increases, for the average musher, for any activity that increases the number of dogs, and there is an additional increase for mushers in the Midwest, racers, and mushers in a higher income bracket. In both equations, all variables were statistically significant at the 98 percent confidence level.
The equations for the number of dogs and the annual expenditures accrued from the kennel can be used to isolate the effects of the racing activity. The two equations were used to examine the total effect of racing in terms of the effect on dollars spent in mushing. For example, if a non-racing musher decides to race, he or she will add an average of 11.11 dogs to the existing kennel (see Table 2). Increased dollars spent per year on mushing will be $2,575 from both the number-of-dog and the race variables' contributions to the dollar equation, or 953 + 11.11 * 146 = $2,575.
Unfortunately, the IFSS racing survey did not contain any questions that could be used to calculate how many individuals entered racing because of its increased popularity and the increased amount of prize money. However, it may be possible to extrapolate the number of new racers by dividing the 1989 and 1993 total reported teams by the number of events. In 1993, there were 41.2 teams per event, whereas in 1989 there were 31.9 teams per event. This is a growth of 29.2 percent. This can be used as a gross approximation of the percentage of new racers per event. If the growth rate of new racers is 29.2 percent, then 4,263 of the additional 14,598 racing teams were new racers competing in one or more races. If each of these new racers was a new musher, then this would have generated approximately $16.3 million dollars annually. If each of the new racers was an existing musher, then the annual contribution of increased racing would have been $10.9 million. Therefore, assuming that new racers are racing just one team per event, the additional annual dollars spent on mushing from the increase in racing since1989 would be between $10.9 and $16.3 million.
Conclusion and the Need for Further Research
It is not possible to derive an exact dollar amount that new racers have contributed to local economies from the Mushing magazine and the IFSS surveys. While prize winnings have increased by 24 percent, the number of races has increased by 96 percent, and the number of entrants has increased by 68 percent. It is estimated that a beginning musher who immediately gets into racing will have a kennel size of 13.9 dogs and add approximately $3,828 a year to a local economy, depending on the area and the mushers' income level. It is estimated that an existing musher that changes his or her focus to racing will add 11.11 more dogs to the kennel and spend an additional $2,575 per year on his or her dogs. Although the exact dollar contributions from the increased emphasis on competitive dogsledding cannot be determined, because it is not known how many more kennels have entered the racing business, the amount could be sizable. It is estimated that it could approach $16.3 million annually since 1989. Since many mushers live in Northern, rural communities, which are often in need of hard currency, the increased emphasis on competitive dogsledding may prove to bring much needed cash into these communities.
Much work needs to be done in this area. There are few works that examine this issue. The surveys by IFSS and Mushing magazine were helpful in their analytical descriptions of the mushing community, but a well-designed scientific survey would be invaluable. Most importantly, it needs to be determined how many mushers exist and how many of these mushers get into racing because of the growth of the sport.
In addition, many mushers depend on subsistence feeding of their sled dogs. This decreases the amount spent for feed. A well-designed survey might attempt to determine how much of the feed comes from subsistence, a factor which would have direct public policy implications for Alaska and other regions of the Polar North. Additionally, an income adjustment index, which would be very timely to construct for all of the different regions, would be helpful in determining if some of the impact of income on the number of dogs and the number of dollars spent is due to cost-of-living differences (however, such an index would be complicated by the fact that many mushers order products by mail). Finally, this discussion only involves direct musher expenditures; an input-output study would help to determine the total impact of a mushing dollar.
References
Anderson, David B. 1992. "The Use of Dog Teams and the Use of Subsistence-Caught Fish for Feeding Sled Dogs in the Yukon River Drainage, Alaska." Technical Paper No. 210. ADF&G. Juneau, Alaska.
Coppinger, L. The World of Sled Dogs: From Siberia to Sport Racing. Howell Book House: New York, 1979. International Federation of Sleddog Sports. "1992-1993 IFSS Sled Dog Survey." Pocatello, Idaho, 1992-1993.
Maddala, G.S. Introduction to Econometrics. MacMillan Publishing Company: New York, 1992.
Mushing Magazine. "Mushing Survey." Ester, Alaska, 1992-1993.
Smith, Amy E. Dog Mushing in Interior Alaska: An Exploratory Study of Participation, Preference, and Willingness-To-Pay. Master of Science Thesis. University of Alaska Fairbanks, 1990.
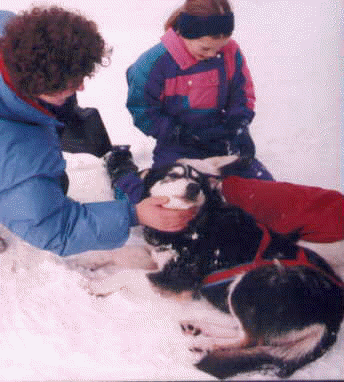
Picture credit: (second picture)Picture by Diane Herrmann: Charlie Boulding's lead dogs rest at the finish line of the 1991 Yukon Quest in Fairbanks, Alaska.
Appendix A. Variable Definitions
| Continuous Variables: | |
| Number of Years | years spent in the sport of mushing |
| Number of Children | number of children |
| Qualitative Variables: (Equal to one if:) | |
| Activities | |
| Weight Pulling | weight pull |
| Skijoring | skijoring |
| Carting | carting |
| Packing | packing |
| Sledding | sledding |
| Camping | camping |
| Racing | racing |
| Hiking | hiking |
| Hunting | hunting |
| Recreation | recreation |
| Working | working |
| Geographic Area | |
| Midwest | residence in Midwestern United States |
| East | residence in Eastern United States |
| West | residence in Western United States |
| Canada | residence in Canada |
| Alaska | residence in Alaska |
| Rest of World | residence in areas other than the above |
| Married | married |
| Single | single |
| Annual Household Income (in U.S. dollars) | |
| I1 | less than $15,000 |
| I2 | between $15,000 and $35,000 |
| I3 | between $36,000 and $49,000 |
| I4 | between $50,000 and $74,000 |
| I5 | between $75,000 and $100,000 |
| I6 | greater than $100,000 |
| Years of Education | |
| High School | 1 to 12 years of education |
| Some College | 13 to 16 years of education |
| College Graduate | 17 or more years of education |